

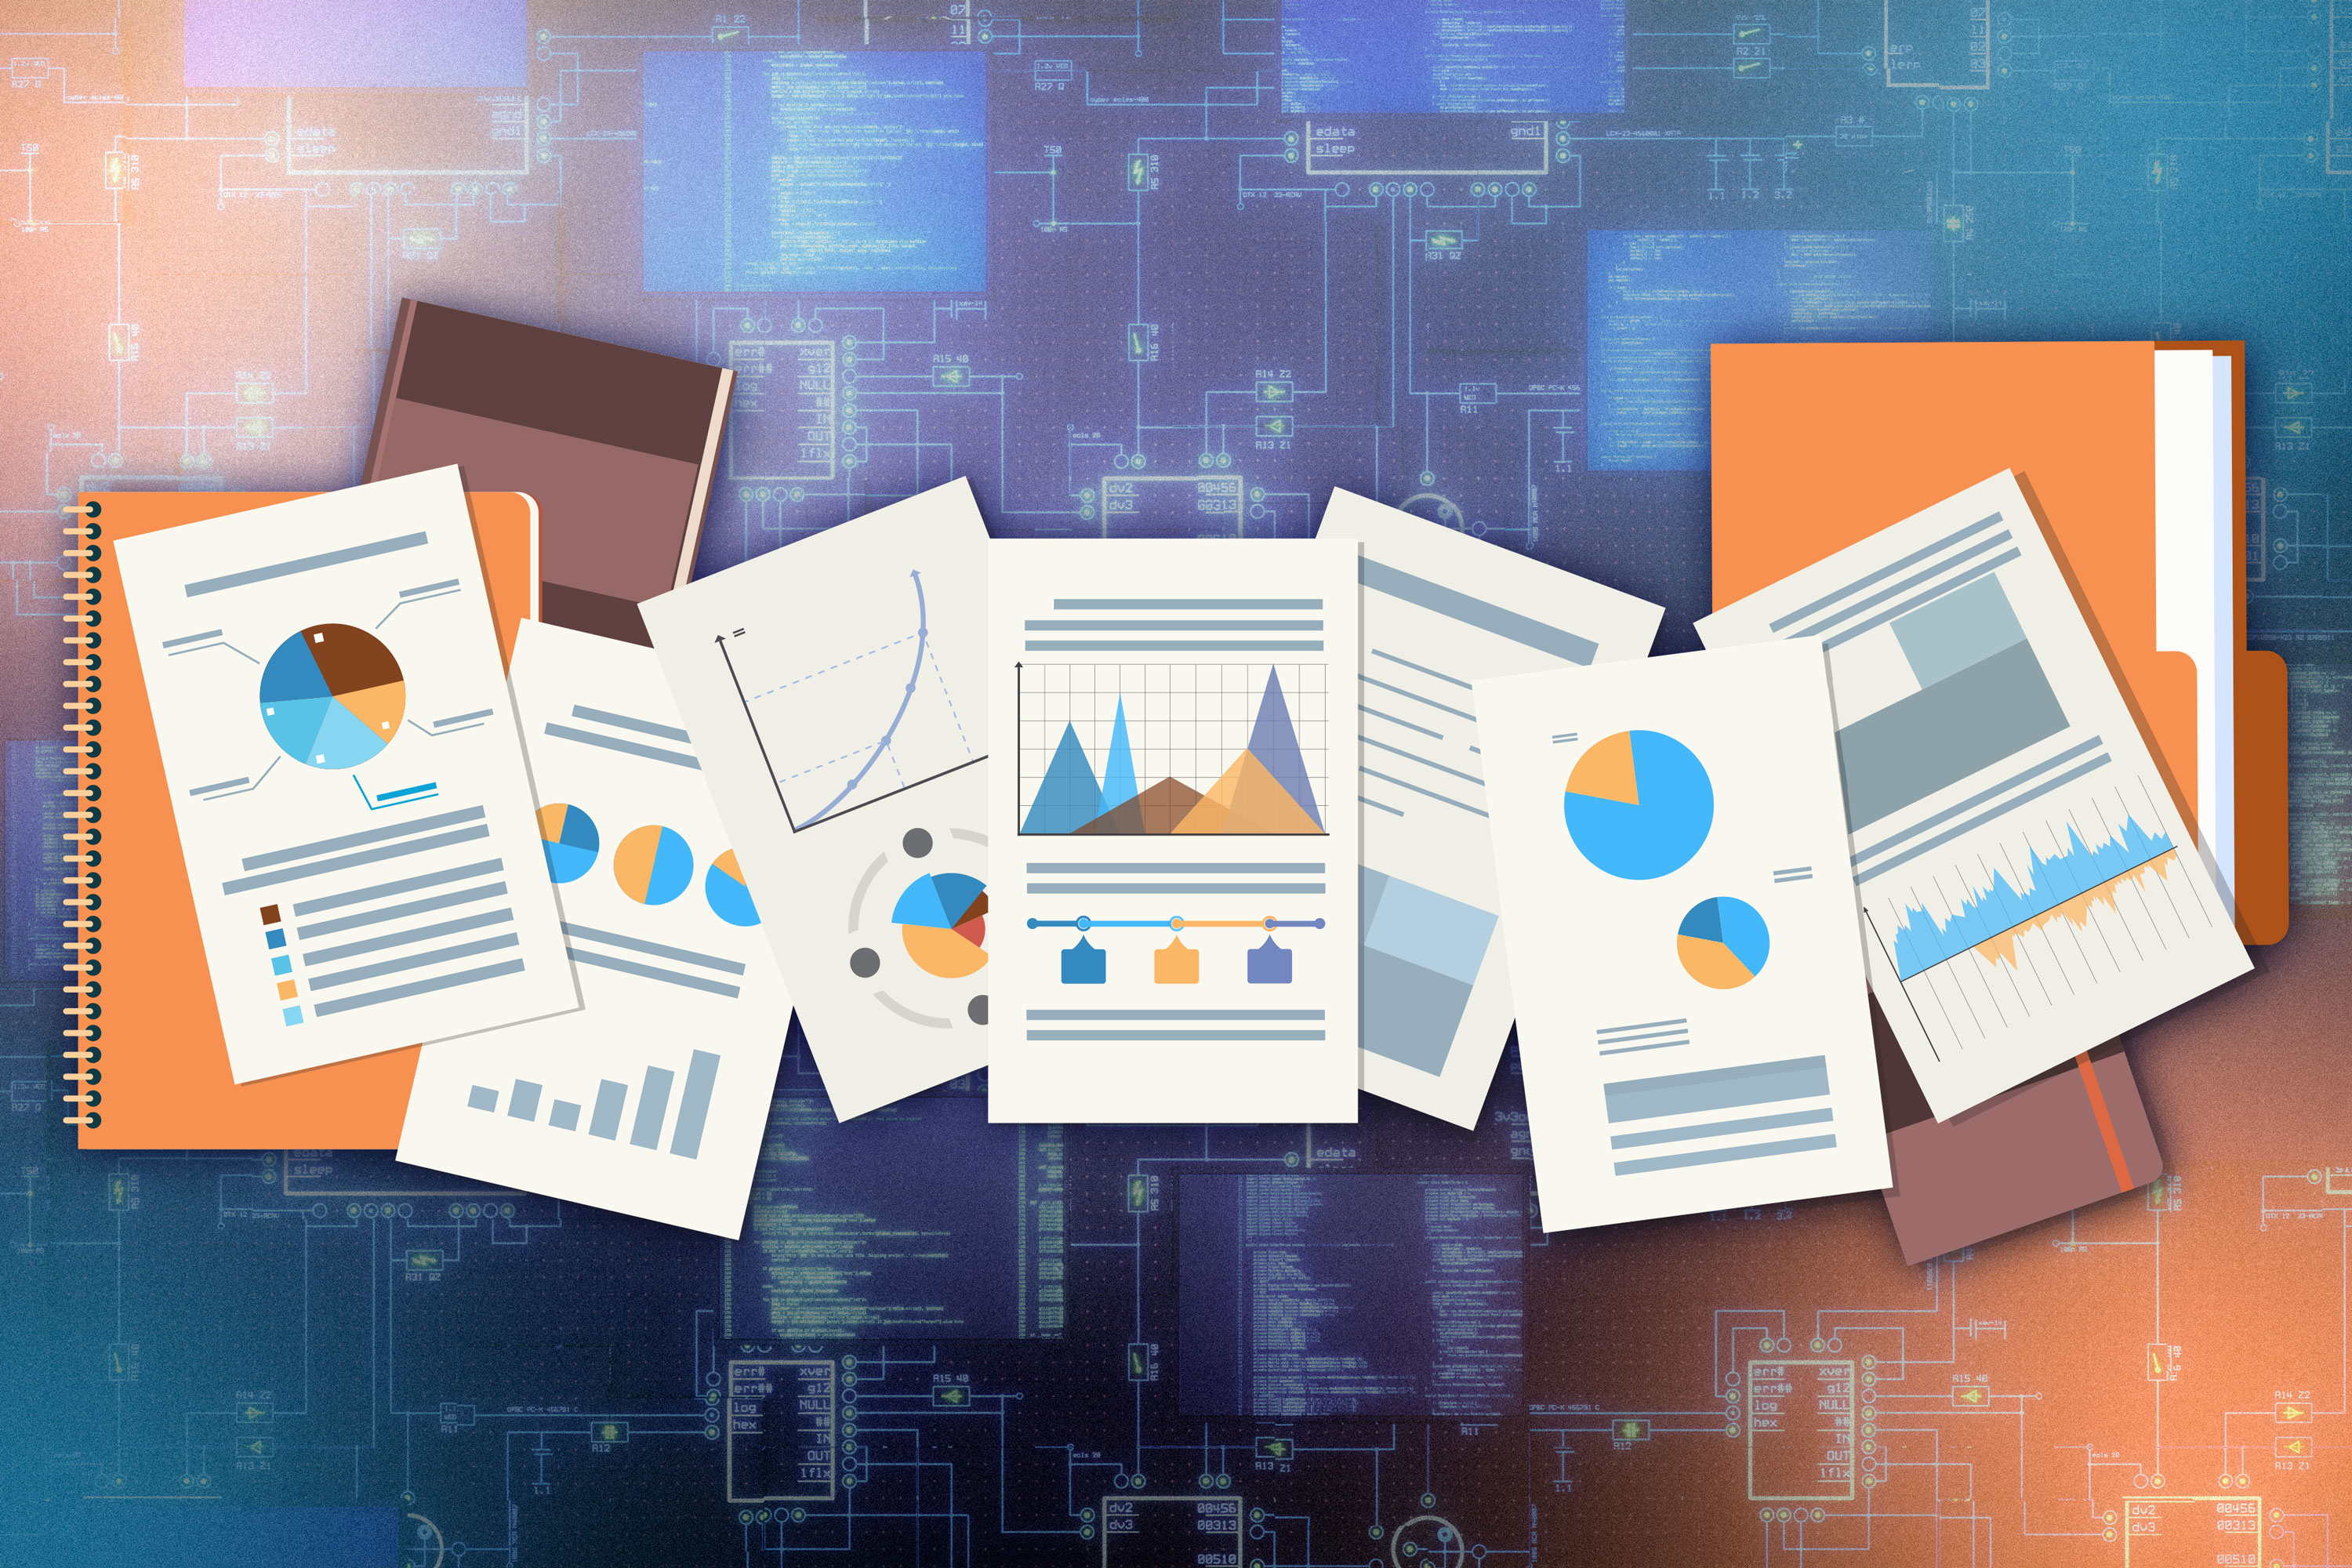
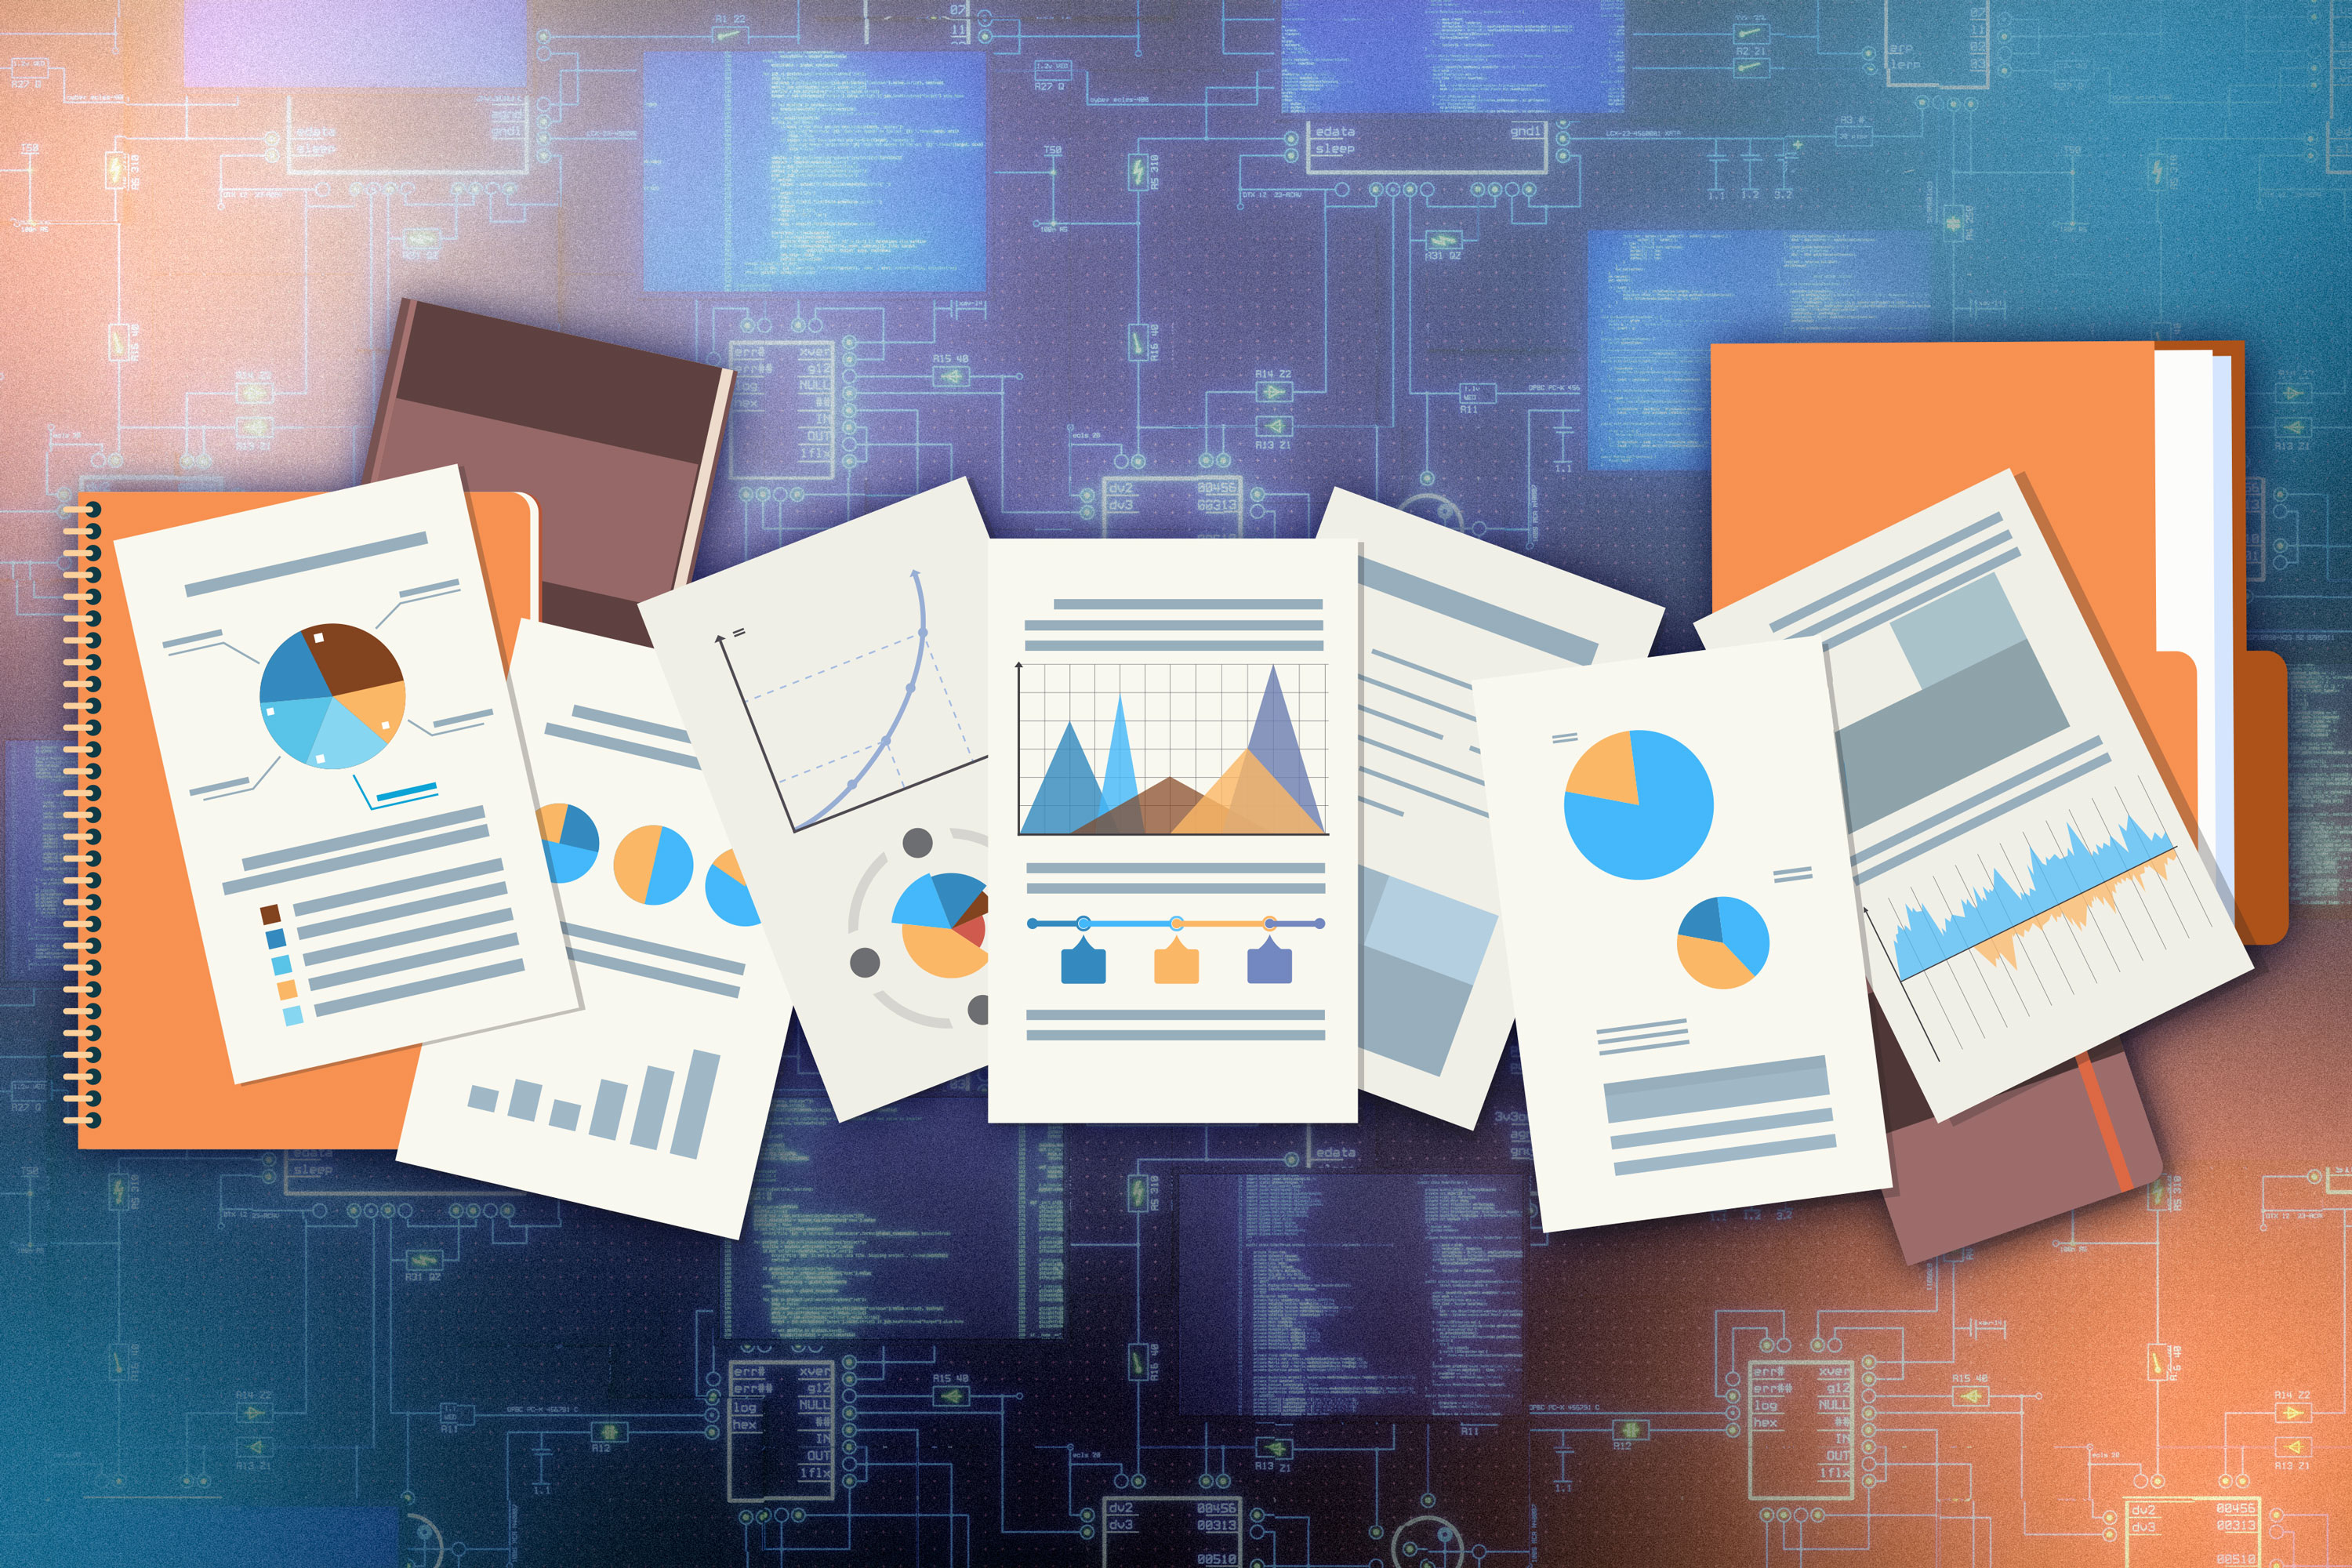
To accelerate and refine decision-making in a fast-paced, global marketplace, enterprises may deploy generative artificial intelligence models to help summarize and interpret the charts that often fill market summaries and financial reports.
But even the latest vision-language models sometimes struggle with this task, since it requires a model to integrate visual, numerical, and linguistic understanding. A company that invests in a state-of-the-art model might still receive inaccurate or incomplete information.
To fill this performance gap, researchers from MIT and the MIT-IBM Computing Research Lab developed a multifaceted resource for AI users that is specifically designed to teach vision-language models (VLMs) how to effectively interpret charts.
They used a novel data generation method to build a state-of-the-art dataset that includes more than a million varied charts. The dataset also encodes many visual, linguistic, and numerical components of each chart image, which enable models to robustly reason about the information in a chart.
The researchers used this dataset, called ChartNet, to train a series of open-source VLMs. Many of these smaller models significantly outperformed orders of magnitude larger, commercial models on tasks like data extraction and chart summarization.
By enabling open-source models to outperform their commercial counterparts, ChartNet could allow small firms with limited budgets to more readily utilize AI. The open-source dataset can be used to improve the capabilities of AI models for tasks like business trend analysis and scientific figure interpretation.
“We developed ChartNet to be a one-stop shop for chart understanding, covering basically anything that an AI model and a practitioner who is training that model might need. We hope our work motivates researchers to achieve state-of-the-art performance with smaller models that don’t require infinite amounts of computation,” says Jovana Kondic, an MIT electrical engineering and computer science (EECS) graduate student and lead author of a paper on ChartNet.
She is joined on the paper by many co-authors from MIT, the MIT-IBM Computing Research Lab, and IBM Research, including Pengyuan Li, a research staff member at IBM Research; Dhiraj Joshi, a senior scientist at IBM Research; Isaac Sanchez, a software engineer at IBM Research; Aude Oliva, director of strategic industry engagement at the MIT Schwarzman College of Computing, MIT director of the MIT-IBM Computing Research Lab, and a senior research scientist in the Computer Science and Artificial Intelligence Laboratory (CSAIL); and Rogerio Feris, a principal scientist and manager at the MIT-IBM Computing Research Lab. The research will be presented at IEEE Computer Vision and Pattern Recognition Conference.
A dataset bottleneck
Researchers have made great strides developing generative AI models that excel at natural language processing and reasoning about natural images. But less work has focused on interpreting complex multimodal data contained within charts, Kondic says.
Yet for large and small businesses in nearly every industry, chart understanding is a critical task.
“The finance industry thrives on charts. If vision-language models can extract information out of charts, like descriptions of trends, that facilitates a lot of workflows that happen downstream,” Joshi says.
The lack of high-quality training data is a major bottleneck holding back the development of VLMs that can accurately interpret charts. Many datasets contain limited chart images pulled from the internet and often lack the necessary scale and additional information to help a model interpret the underlying data.
“A vision-language model, unlike our brains, may need to see thousands of examples during training to reliably recognize something as a line chart,” Kondic says.
The researchers sought to overcome those shortcomings by generating synthetic data. Synthetic data are artificially generated by algorithms to mimic the statistical properties of actual data.
The ChartNet dataset holds more a million high-quality chart images, along with the corresponding code used to generate each chart, a textual description, and a table that contains its numerical information. In addition, each datapoint includes question-and-answer pairs to teach the model how to correctly answer questions about the chart image.
“These additional modes of data guide the model to connect and align the different pieces of information that the chart image encodes,” Kondic says.
Data generation
To build ChartNet, the researchers created a two-step, synthetic data generation pipeline.
First, their automated system translates any pre-existing set of chart images into code. Then the system iteratively augments that code to change different aspects of each chart, such as chart type, data values, topic, colors, etc.
“We can start from a single chart that we use as a seed and come up with hundreds of augmentations of it. This is how we were able to build a dataset with more than a million diverse images,” Kondic explains.
They also incorporated an automated quality check process to ensure the synthetic data are high quality. This process verifies that the code is executable and rendered chart images are accurate and clean.
“We don’t want to just be generating diverse samples. We also want the information to be presented in a meaningful way,” she says.
ChartNet also includes a selection of chart datapoints annotated by human experts. This provides access to additional types of charts and supporting data that carry validity guarantees.
A practitioner could use the annotated data to fine-tune an existing VLM, further boosting performance for a specific application, Joshi adds.
The researchers tested ChartNet by training IBM’s Granite Vision series of models as well as several other open-source models of various sizes and evaluating them on various chart interpretation tasks. The dataset improved the accuracy of all models in chart reconstruction, chart data extraction, chart summarization, and chart question answering.
With ChartNet, small open-source models consistently outperformed much larger commercial models.
“A lot of prior training datasets only focused on answering simple questions about a chart. We tried to go beyond that with ChartNet by generating data that support all aspects of robust chart understanding,” Kondic says.
In the future, the researchers plan to continue expanding ChartNet by incorporating data with added levels of complexity. They also want to draw on feedback from the research community.
This research was funded, in part, by the MIT-IBM Computing Research Lab.
